Advanced Metering Infrastructure (AMI) via smart meters has fundamentally changed the way customers engage with energy. With an exponential increase in energy data, customers now have up to 1,440 data points on their energy use per month compared to a single record view. Using this data, utilities can drastically improve the customer experience and also allow for much faster energy savings measurement than with current monthly evaluation models.
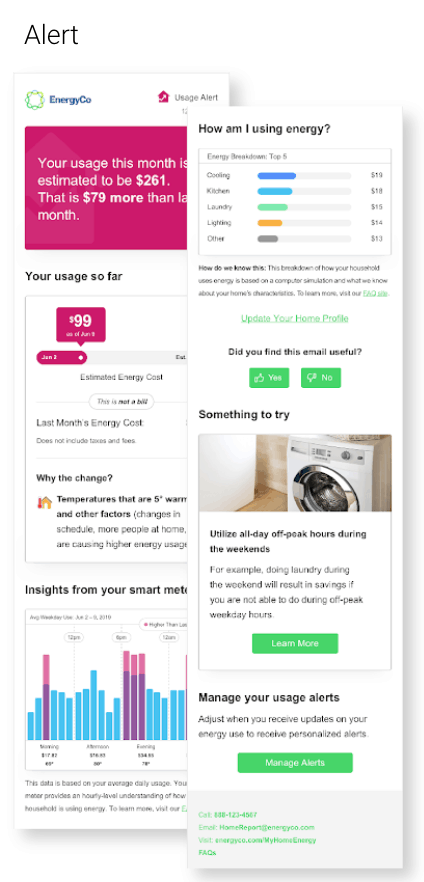
Uplight’s AMI-based product consists of two core offerings — high usage alerts and mid-cycle updates. This product, designed to help utility customers increase ongoing engagement and energy savings, leverages smart meter data to provide a more personalized view of a customer’s energy consumption. The alert is sent digitally, the ideal channel for providing near real-time energy usage feedback that empowers customers to make immediate energy savings actions. The initial engagement and savings results from a 6,000 customer pilot indicate that AMI-based digital alerts may be a cost-effective complement to traditional Behavioral Energy Efficiency solutions.
Pilot Measurement
In the first 6 months of the pilot, we have seen a 55% average open rate for the mid-cycle update version of the AMI Alert product and a higher engagement rate of 67% for the high usage alert version—about 3 times the industry standard open rate. The click rates are 9% and 12% for the mid-cycle update and high usage alert, respectively—about 4 times the industry standard. The customer satisfaction results also indicate a high level of engagement. Of the customers who engage with the “Did you find this email useful?”, 84% clicked “yes” for the high usage alert and 92% clicked “yes” for the mid-cycle update.
Initial savings results corroborate the high engagement results. The alert is achieving an average incremental savings of 3.2%, depending on the alert type and if the customer is in the Home Energy Report program–trending for more as we move into the summer season. The data science team has a savings evaluation infrastructure in place that monitors the alert’s energy efficiency impact and open/click rate results over time to understand what is working and ideate on future product improvements.
AMI Alert Design and Impact
A cross-functional team made up of behavioral science, engineering, design, product, & data science at Uplight designed this AMI-based product in a way that allows all eligible customers, not only extremely high energy users, to receive a mid-cycle energy update at least once a month. The update provides valuable information on how the current bill and usage is tracking compared to the last bill. A customer’s bill may be higher, but not high enough to trigger a high usage alert. In those cases, there is still value in notifying customers of their current energy usage status in a non-alert context. Similarly, it is also helpful to inform customers if they are on track for a lower or similar bill as the alert can provide positive reinforcement.
By expanding the alert-type messaging to encompass positive reinforcement, we boost the number of personalized email notifications sent by 6-fold per year, provide another valuable and consistent touchpoint for the utility every month, and ultimately increase the total potential savings impact.
Personalization Increases Engagement
Uplight’s AMI-based Alert provides a level of personalization that goes beyond the ‘what’ and gives customers a more detailed breakdown of their energy usage in terms of why, how, and when. The high usage alert and mid-cycle update each come with additional modules — “Why The Change?”, “Top-5 Energy Disaggregation Breakdown”, and “Smart Meter Hourly Insight”. All three of these have resonated highly with our customers based on survey feedback results.
The “Why The Change?” module informs the customer why their energy usage has changed beyond the obvious weather reason. We can use the data to determine if the change is because of weather-only, behavior-only, or weather and behavior.
The Top-5 Energy Disaggregation Breakdown provides a breakdown of how the household uses energy (e.g. dollars spent on cooling, lighting, laundry, etc) based on a building model simulation and what we know about the home’s characteristics.
The Smart Meter Hourly Insight graph provides an hourly-level understanding of when the household is using energy in the current bill compared to the last bill. With this unique feature, we are able to provide a more personalized experience for customers as it highlights exactly when they are consuming the highest and least amount of energy in the day and how that compares to the month before. In a survey, we asked customers “Which aspect of the hourly usage graph do you most like?” The responses include a wide range of positive sentiment. One customer commented that the “graph helps me to ‘zero in’ on what time of day I use the most electricity. The graph makes me more aware and allows me to make some necessary changes in my home.” Overall, customers like the benefit of more data with comments such as “I like more data and to be able to display them in multiple ways,” and “The more data the better!”
The Power of AMI
Higher granularity in AMI increases the AMI Alert’s model accuracy which ultimately improves customer experience and expands the product’s reach. The more accurate we are at predicting upcoming bills, the more likely customers will trust the forecast and all other information we provide in the product. Building trust increases customer satisfaction and engagement. Higher engagement drives higher savings.
With a monthly model, we usually require about a year’s worth—12 energy records—to fit an accurate regression model. With hourly-level data, we now have 8,760 hourly data points in a historical year per household.
We use the full history of data if available, but a month’s history of hourly AMI at minimum is usually sufficient to build an accurate prediction model. This relaxed eligibility requirement expands the product’s reach to new customer types that have historically not been eligible for many legacy Behavioral Energy Efficiency programs that typically require 13 months of historical bills. This is extremely valuable from a product impact perspective because, for example, new movers are now eligible to receive information about their energy usage at a time when they are typically willing to make the most changes to their energy systems and behavior.
Real-time Measurement Capabilities
In addition to increased accuracy, the more granular level AMI data also allows us to gauge program effectiveness much sooner; whereas, with traditional energy efficiency program evaluations that leverage monthly-level bills, we typically need to wait at least 3 months before we see results. In addition, the 1,440-fold increase means we have more power to detect statistically significant savings with greater confidence. We also have an improved understanding of when customers take energy savings action at the day level.
The Uplight AMI Alert Vision
Uplight’s AMI-based digital alert product is accelerating the green energy ecosystem by providing all customers a more personalized energy intelligence experience. This dynamic view of energy usage available to millions of customers each with thousands of energy records would not be possible without the advanced technology that can process AMI at lighting-fast speed and deliver the product on a daily basis. Universal deployment of advanced metering infrastructure is the grid of the future with at least half of all US utility households already equipped with smart meters. It’s time to unlock the full potential and reap the benefits of this additional, real-time data with AMI alerts.