As I often do when I want to crank through some work (caffeinate), I’m working from a coffee shop today. It is brightly lit with what appear to be LEDs and always has some upbeat music playing, which, along with the perky staff, always makes it an inviting and pleasant place to be. Aside from expected energy users of HVAC, grinders, various hot water sources, and dish cleaning, it has a small refrigerator for burritos and sandwiches. Given that they roast their own beans, I know there is a roaster in the back which may lead to my car smelling of coffee and smoke when I leave. There are hours posted on the door which are generally consistent, but vary a bit on the weekends and holidays.
Along with information about the building’s construction, these are some of the minimum details necessary to know what sorts of energy use modification techniques are even applicable to the physical space.
Only the coffee shop occupies the building. Given some recent modifications, I also suspect that the building is owned by the coffee shop owner. These too are important facts. Combined with a record of past improvements, they might tell us what sorts of changes the key decision makers would be willing and able to make.
There are over 30 million businesses in the United States alone. It would be a monumental task to learn this level of detail about every one through an onsite visit.
One Second or Less
The challenge posed to utilities is how to give relevant actionable information to the right decision maker for each commercial and industrial customer. Given the scale of the challenge, the only cost effective solution must involve nearly complete automation.
Building science tells us that to give relevant recommendations about a building’s energy use options, we must have accurate information about the internal workings of a building. The most important factor for commercial buildings is the collection of energy use patterns characterized by the dominant activity in a space. Examples include coffee shop, office, and agriculture. At Uplight, we call this concept “primary activity”.
However, there aren’t many good sources of this fact readily available, and we have measured that typical utility primary activity data is only 20% accurate and only covers 30% of the population.

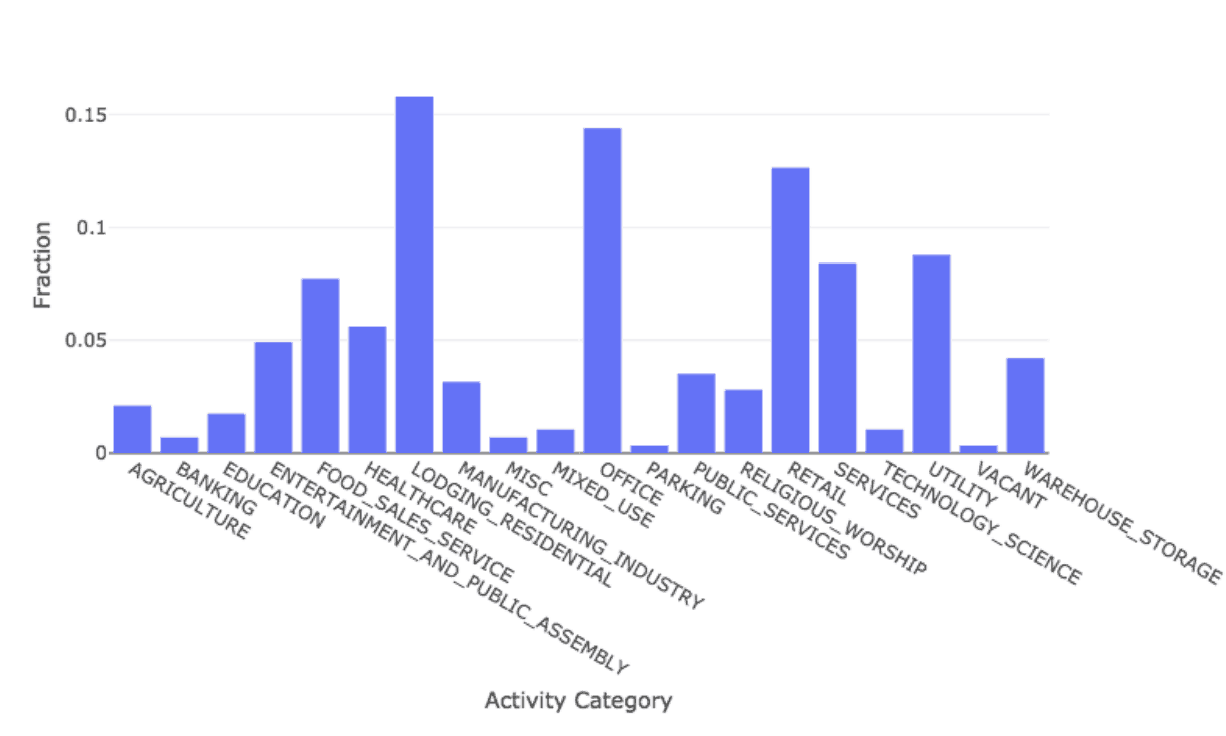
In the above, we show the approximate breakdown at a coarse category level of primary activities for one utility service territory. This territory has a large presence of multifamily housing, office space, and retail stores. It is clear that the energy drivers for these types of buildings will be different, let alone for the also prominent utility type meters like street lighting and telecommunications.
The above set of data was collected by skilled building scientists. That can only be done for a small fraction of buildings due to cost. What about for all commercial premises?
Here at Uplight, we manage data for over 6 million commercial premises. At a time when machine learning is more and more a part of everyday life (Hello Alexa, Siri, and all those Deepfake videos!), it seems only natural that a company with deep machine learning expertise and insight into a considerable fraction of US commercial meters would be able to turn this mountain of data into useful information.
And, that’s exactly what we’ve done.
AI luminary Andrew Ng gives a rule of thumb that anything a person can do with a second or less of mental effort is a good target for a machine learning solution. In our case, a quick task might be looking at all the data about a building and determining what the primary activity is.
Of course, the verb in machine learning is “learn”. Human learning happens in many ways. We can learn by being told the rules or by example. In machine learning, we start by not knowing the rules governing relationships in complex data patterns, so we must rely on examples to learn them.
That’s why we’ve curated a database of hundreds of thousands of examples where we have reliable information about buildings and those who operate them. Combining this database with utility data allows our algorithms to learn how to map data patterns to critical facts that drive action recommendations. These recommendations provide a starting point for motivating energy efficiency at scale.
The Human Side
Identifying equipment and operations from data signals well enough to provide a menu of options to a business is one challenge. But, if that menu isn’t shown to the right decision makers, or if the message isn’t compelling, then it’s not likely to lead to action.
If a utility were to send an applicable recommendation about HVAC scheduling to whatever email address is on file for my coffee shop’s account, who does it go to? Is it the owner, general manager, or a property manager? What are the needs of these different actors that would cause them to consider that scheduling improvement a priority?
At a time when utilities are looking to move beyond low hanging fruit to meet commercial and industrial energy goals, we combine segment specific building data expertise with a team that has proven adept at motivating residential energy users.
Knowing how energy is being used and why and how the user might be willing to change from automated analysis is the full picture when it comes to automating energy conservation programs. It’s exciting to finally see how the details are coming into focus for commercial and residential customers.


